UX Design
When identified correctly, seemingly simple changes can lead to improvements that can propagate through the entire organization’s chain of command. This is just what I experienced in my most recent role at TBWB Strategies when I innovated their design production system using a combination of existing tools.
Here is a description of the design process that I’ve fleshed out with UX design concepts that in hindsight would have facilitated a more agile adoption of the product. All infographics were designed by me.
CASE STUDY: TBWB STRATEGIES (2016)
TBWB Strategies is located in San Francisco, CA.
Product: Digital Change Board
Date: May 2016
Platform: Desktop & Mobile
Challenge:
As the Art Production Manager, my purpose was to make sure all 2000+ design pieces for ~80 clients were designed correctly prior to client approval and mail drop dates. Additional parameters included a budget for 5-7 rotating contract artists & 3 full-time artists who were shared with one other company (TBW). A new system would also require on-boarding of all TBW partners and staff members. A new project management tool was being implemented company-wide but it did not have a function to manage large volumes of request that demanded a quick completionturnaround. The current process involved emails, a physical whiteboard for tracking, and google hangouts for direct communication.
Previous TBWB/TBW Change board (2010-2016).
WHAT I DID
Setting goals and objectives
Stakeholder interviews
Establishing key audience
Building personas
Creating scenarios
Creating Low-fidelity prototypes
Usability testing
Developing product iterations
Quantifying User Experience
OLD Tool (2010-2016)
Deteriorating White board with white board markers
Email & Verbal communication
TBWB/TBW Server
Current Tool (2016-now)
Custom tailored Google Form
Custom tailored Google Sheets Document
Google Hangouts
TBWB/TBW Server
Setting goals and objectives
What is this new system?
TBWB Strategies is a strategy and communications consulting firm specializing in public finance ballot measures supporting programs, services and facilities. A bulk of their communication materials are digital designs for direct mail, online ads, websites, and for social media display. The new system is a digital production organization system that quickly and efficiently relays design requests between client staff and graphic artists.
What are the goals of the system?
The goal is to develop a highly intuitive digital system that can be quickly adopted by any level of user. This new system will effectively organize information needed to facilitate quick turnaround of digital design requests from client staff to digital artists.
Who are the users of this new tool?
Primary audience: TBWB & TBW Client Staff Members and Graphic Artists
Secondary audience: TBWB & TBW Partners, Clients
Conducting Interviews
A compilation of my notes on interviews with key stakeholders at TBWB Strategies. Interviews provided me a qualitative method of gathering evidence, data and information applicable to the new system I was developing. The stories of each member helped me color a detailed picture of why such a system had not been implemented sooner in order to prevent those mistakes and to facilitate a more agile adoption of a digital system.
ESTABLISHING KEY AUDIENCES
Interviewing the stakeholders had helped me identify the primary audience for the digital change board and the characteristics of study participants. As with every product or service, the best offering comes from correctly identifying the target audience, their needs and their wants.
Building personas
How do they keep track of inFO?
WHO ARE THEY?
Decision Makers & Information Relayers
Age: 22 - 35
Gender: Mixed
Family: Mostly single, or married w/o children
Education: at least undergrad, Political Science & other Social Sciences disciplines
Pain Points
They maintain their own spreadsheets of information
Organized files on Google Drive
Handwritten notes on hardcopies of designs
Google calendar for reminders, inspiration, etc.
TBWB company wide server for team documents
I compiled all pain points and concerns, mainly quotes from individual contributors and organized them by category of client staff, partners, and artists, as well as my socialization manager who worked with the affiliated company (TBW). The primary concern problem is that the Client Staff and Artists are under a lot pressure to produce successful campaigns under tight deadlines due to Elections timelines. It especially gets extremely busy towards elections, and most people are not comfortable with adopting new digital system especially if it interferes with current work flow. What they done for the last 10 years has worked well enough.
Main goals/ What do they want?
Motivation
A better system that can easily be picked up without any interference into their daily schedule.
Free up extra time to focus on making their campaigns more effective.
Having remote access to the "change board" - ability to work from home if needed.
To work faster and work efficiently.
To reduce cost of hiring graphic designers.
To produce better designs by freeing up more time as pieces move faster through design process.
To do deal with the least amount of stress when dealing with a new system adoption.
Creating Scenarios
Developing a user journey around my original concept was very useful in demonstrating the way users could interact with the new system. In this scenario, I demonstrated how simple this procedure would be, and proved effective in elevating stress from the users caused by the uncertainty around novel concepts. I illustrated, hierarchically, the series of steps necessary for the user to take in order to process their requests through the updated system.
Creating Low-fidelity prototypes
Google Sheets was the first and most feasible option to base a low-fidelity prototype of the digital change-board for several reasons, the main ones being:
1. We essentially need a digitalized spreadsheet to replace the previous version;
2. Google Sheets is free resource that can be accessed by anyone with a link to the board;
3. It has many customizable features, and even a section for injecting code for higher functions.
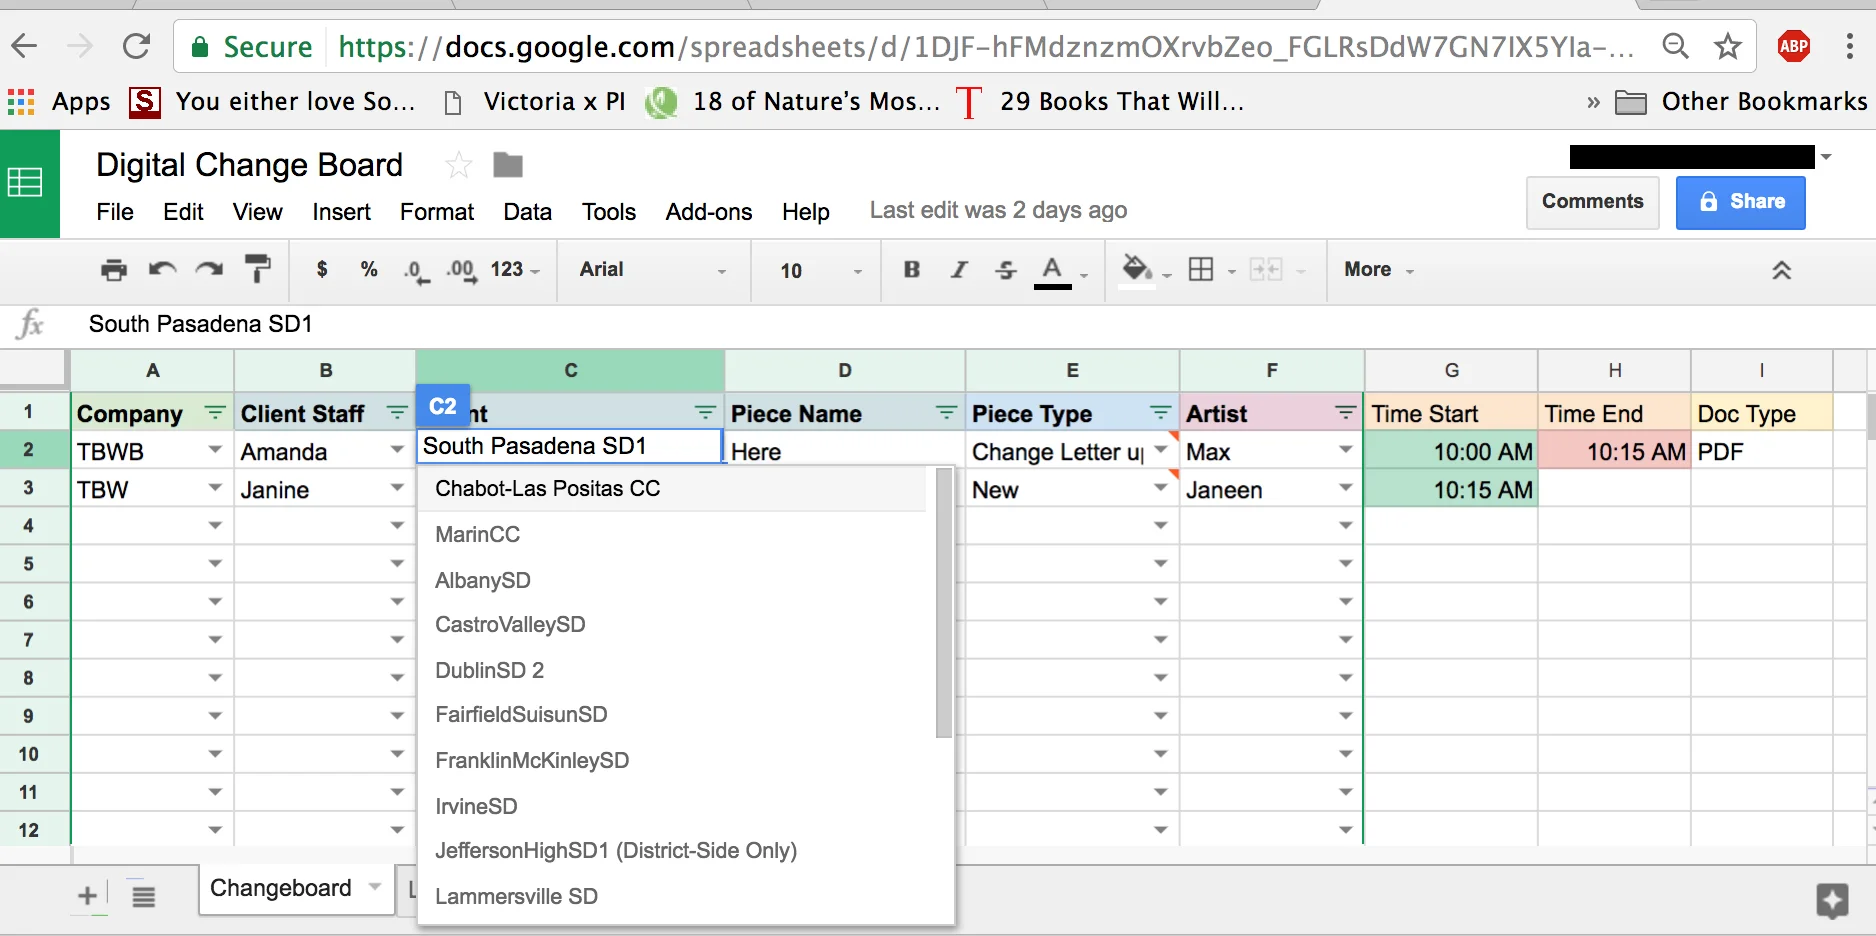
Creating a digital spreadsheet quickly test out whether or not functionality of the new digital version of the existing system was convenient enough for the Client Staff Members and the Graphic Designers to quickly incorporate into workflow.. Luckily the original "Change Board" was essentially the "wireframe design" of what would become our low-fidelity prototype- all categories from the original board was used as all components had been deemed essential to the process for 10 years. Several new categories were determined by the popularity of requests which had been collected through interviews.
Usability testing
Watching users try to accomplish tasks on early prototypes was the most effective and efficient way to uncover usability problems. Surveys were also collected by users to better understand how effective the new design was and what aspects could be improved upon. Also observing what parts of the digital change board were not being utilized was also helpful in exploring potential solutions during the design process.
Project Outcome: FINAL PRODUCT
Final Product: After several iterations, our final product included a Digital Request form that compiled requests on a Google Sheet, which we injected with a code that wide automatically update the sheet with a "Timestamp" whenever new jobs were started and completed.
Project Outcome: Quantifying User Experience & Achievements
Offering a system that was easy to adopt and streamlined workflows while accelerating the processing of requests were key in developing a digital system that offered value to key contributors and stakeholders. A well designed system retained all users, eliminated all errors that resulted in communication, and influenced a 100% success rate of projects that moved through the new system. Adoptability was also attributed to the ease of information relaying from requests to interpretation over physical designs. A refreshed and dynamic user interface attributed to Google Sheets and Forms kept the new digital system feeling contemporary and relevant. In terms of quantifying user experience, savings were calculated across multiple financial spreadsheets and were compared to the previous primary elections data (November 2014).
End of Document


